Every transportation team knows the feeling of making routing decisions based on incomplete information. You adjust a route based on driver feedback, shift a bell time to accommodate bus availability, or reassign students without fully understanding the downstream impact
The districts that consistently improve their operations share one thing in common: they track the right data. Not just any metrics, but the specific transportation data tracking points that reveal patterns, expose inefficiencies, and guide better decisions. When you know what to measure, you can actually improve it.
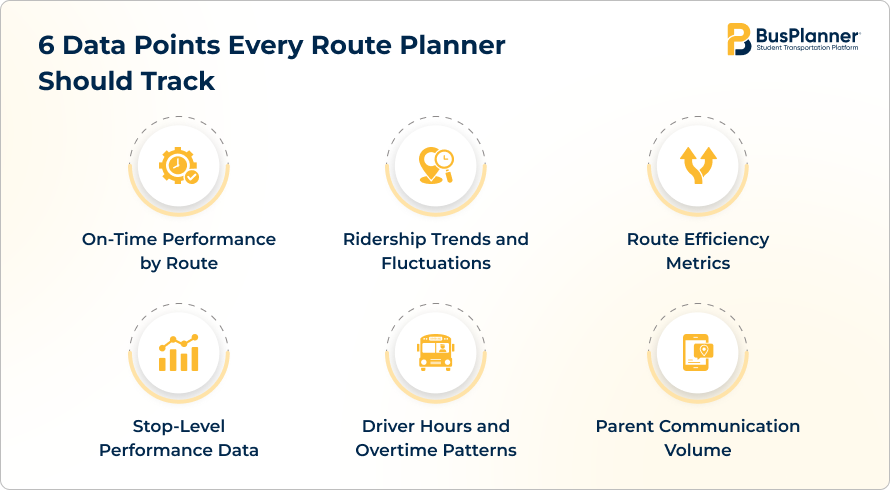
Here are six critical data points that set proactive transportation departments apart from reactive ones.
1. On-Time Performance by Route
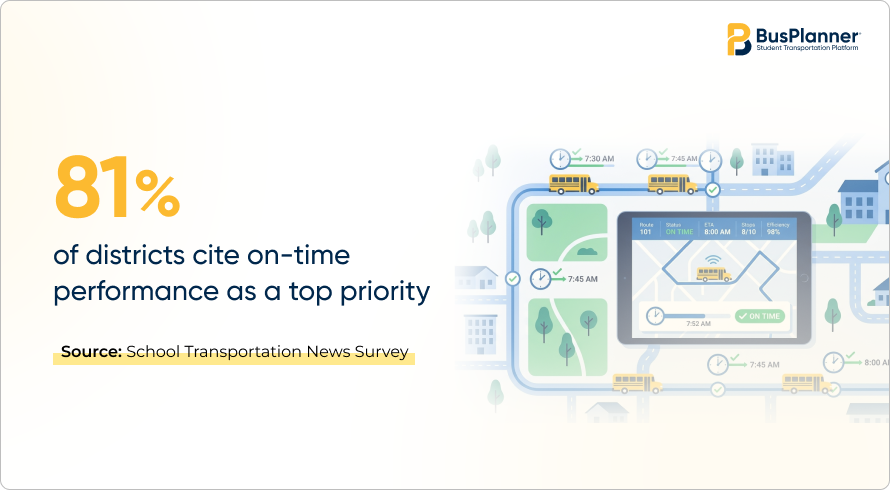
A route that looks efficient on paper might consistently run late due to traffic patterns, construction zones, or unrealistic time windows. Tracking this metric by individual route helps you identify which runs need adjustment.
Most districts define on-time as arriving within five minutes of the scheduled pickup or drop-off time. The key is tracking this consistently across all routes so you can spot trends. A GPS tracking system automates this measurement rather than relying solely on driver reports.
When you measure consistently, you can correlate late arrivals with specific variables like:
- Day-of-week Patterns: Monday delays often look different from Friday delays. Spotting these patterns helps you adjust staffing, sequencing, and even bell-time conversations with school administrators.
- Driver Assignments: Performance can vary across staff for reasons unrelated to skill, such as route familiarity or shift fit. Driver tracking helps you spot where coaching, reassignment, or schedule adjustments could improve outcomes.
This turns anecdotal complaints into actionable insights.
2. Trends & Fluctuations in Ridership
Ridership numbers change constantly as families move, students age into or out of eligibility, and parents opt in or out of transportation. Yet many districts only review these numbers during the annual planning cycle. Regular ridership tracking through your online portals reveals patterns that should trigger route adjustments long before capacity becomes a crisis.
The goal is not just counting heads but understanding why ridership changes. Look beyond the headcount:
- Riders Dropping off on Specific Routes: Sustained drops in ridership often mean overly long ride times, unreliable service, or stop locations that no longer work for families. Investigating early prevents bigger losses later.
- Neighborhood Growth Signals: Certain neighborhoods will show ridership growth months before it becomes a capacity problem. Spotting that growth early gives you time to plan for additional capacity rather than scrambling at the start of a new year.
- The Gap Between Eligible and Actual Riders: A wide gap often reveals opportunities to improve service or communication with families. It can also surface eligibility confusion that's worth addressing directly. Track both actual ridership and eligible students who are not riding. That gap often reveals opportunities to improve service or communication with families.
3. Route Efficiency Metrics
Efficiency metrics tell you whether you are getting the most value from every bus, driver, and gallon of fuel. The most useful transportation KPIs in this category include deadhead miles, average bus occupancy, and total route time compared to actual ride time. These numbers directly impact your budget and service quality.
The most useful KPIs in this category include:
- Deadhead Miles: The distance buses travel empty between the yard and first pickup, or between routes. This is pure cost with no student benefit. Districts using modern route-planning software typically reduce deadheads by optimizing start points and run sequences.
- Average Bus Occupancy (ABO): This shows route density. A route covering many miles with few students costs more per rider than a compact route serving the same number of students. The metric helps you evaluate whether walk zone changes or eligibility adjustments might improve overall efficiency.
- Total Route Time vs. Actual Ride Time: This shows where scheduled time and actual ride time differ. Tracking the variance helps you adjust before the gap costs you in overtime or service complaints
4. Stop-Level Performance Data
Individual bus stops are where your routing plan meets reality. A stop location that made sense five years ago might now be unsafe due to development, unnecessarily far from student homes, or routinely causing delays. Tracking stop-level data through a GPS system helps you continuously refine these crucial touchpoints.
- Dwell Time: Buses consistently waiting more than 30 seconds suggests students aren't ready at scheduled times.
- Boarding Counts: Reveals which stops are underused or over capacity.
- Delay Frequency: Multiple delays at the same stop might indicate poor visibility, difficult turns, or traffic conflicts.
When you can show that a stop serves only two students who board inconsistently and causes three-minute delays, the case for adjustment becomes clear and defensible.
5. Driver Hours & Overtime Patterns
Driver compensation is typically your largest transportation expense, making hours and overtime critical route performance metrics. Yet many districts only review this data during payroll processing, missing opportunities to adjust routes and prevent costly overtime before it accumulates. Real-time tracking shows which routes consistently push drivers into overtime and which runs could be reassigned to spread hours more evenly.
Effective fleet management means matching driver availability with route requirements. Some drivers prefer split shifts, while others want consolidated blocks. Understanding both route demands and driver preferences helps you build schedules that minimize overtime while maintaining service quality and driver satisfaction.
Track not just total hours but also the gap between scheduled hours and actual hours. Routes that consistently run over their time allocation need investigation and adjustment, not just extra pay for the driver.
6. Parent Communication Volume and Patterns
The number and type of parent contacts your office receives directly reflect your transportation service quality. High call volumes typically indicate confusion about routes, concerns about safety, or frustration with reliability. Tracking these interactions reveals which aspects of your operation need improvement and helps you measure whether changes are actually working.
Modern parent portal systems reduce routine inquiries by giving families direct access to route information, bus locations, and schedule updates. When you track both portal usage and direct contacts, you can calculate how much self-service tools actually reduce administrative burden and improve the parent experience.
Categorize contacts by type rather than just counting them:
- Pickup Time Questions: Anticipates how enrollment shifts or boundary adjustments affect routing and fleet needs.
- Driver Behavior Complaints: These need immediate attention and investigation. Patterns across multiple complaints about the same route or driver are signals that should never be ignored.
- Route Change Requests: These could indicate legitimate service gaps or a misunderstanding of eligibility policies. Both are worth addressing directly with families to reduce repeat contacts.
The Bottom Line
Transportation data tracking is not about collecting numbers for their own sake. It is about building a clear picture of how your system actually performs so you can make informed decisions rather than educated guesses. The six data points covered here form the foundation of continuous improvement in student transportation operations.
Start with the metrics that address your biggest pain points. If late buses generate the most parent complaints, focus on on-time performance first. If budget pressure is the primary concern, prioritize efficiency metrics and overtime patterns. As your transportation data-tracking capabilities mature, you can expand to include additional route performance metrics to support long-term planning through tools such as redistricting analysis and demand forecasting. The districts that consistently improve their service share one characteristic: they measure what matters, act on what they learn, and never stop refining their approach.
FAQs
Q1. What is transportation data tracking, and why does it matter for school districts?
Transportation data tracking is the systematic collection and analysis of operational metrics, such as on-time performance, ridership patterns, route efficiency, and driver hours. It matters because it transforms routing decisions from guesswork into evidence-based planning, helping districts reduce costs, improve service quality, and respond proactively to changing needs. Districts that consistently track the right metrics outperform those that rely solely on anecdotal feedback.
Q2. How do route performance metrics help reduce transportation costs?
Route performance metrics identify specific inefficiencies that drive up costs, such as excessive deadhead miles, overtime patterns, and underutilized buses. By measuring students per mile, route duration variance, and load factors, districts can consolidate routes, eliminate unnecessary stops, and balance driver assignments to minimize overtime. Most districts that use route optimization software reduce operating costs by 10 to 20 percent in the first year.
Q3. What are the most important school bus analytics for improving on-time performance?
The most valuable school bus analytics for punctuality include first-stop arrival times, route duration variance, and stop-level dwell times. Tracking these metrics helps you identify whether late arrivals stem from unrealistic scheduling, traffic patterns, driver performance, or student readiness issues. This targeted analysis allows you to make specific adjustments rather than adding slack time across all routes.
Q4. How often should transportation departments review their key performance indicators?
Critical transportation KPIs, such as on-time performance and driver hours, should be reviewed weekly to catch problems before they become systemic. Ridership trends and route efficiency metrics benefit from monthly analysis to identify patterns and seasonal changes. Stop-level performance and parent communication data can be reviewed quarterly unless specific concerns arise. The key is establishing regular review cycles rather than waiting for annual planning periods to examine your data.
Q5. What is the connection between transportation data tracking and parent satisfaction?
Transportation data tracking directly improves parent satisfaction by enabling proactive communication, reliable service, and faster problem resolution. When you track on-time performance, you can notify families of delays before they happen. Ridership data helps you adjust routes to meet actual needs. Parent communication metrics show which issues cause the most frustration, allowing you to address root causes rather than just responding to complaints. Districts with robust tracking systems typically see 25 to 40 percent reductions in parent call volume.