Numbers are the backbone of student transportation departments, providing crucial insights into operational efficiency, service reliability, and cost-effectiveness. But how do you make sense of these numbers? More importantly, how can they help you improve your transportation services?
Do you think your department is currently collecting and leveraging data adequately for performance improvement?
Poll (single answer required):
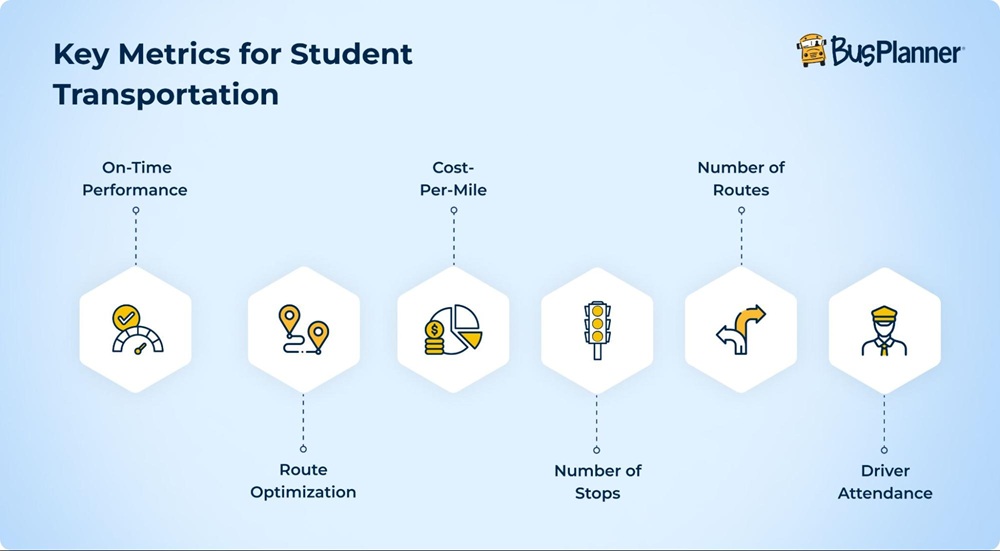
Let’s break it down by exploring some of the most critical metrics for student transportation departments and how you can use them to drive improvements:
Keep Buses on Schedule by Understanding On-Time Performance
This metric tracks the percentage of buses arriving on schedule. A decline in on-time performance may signal issues such as traffic congestion, inefficient scheduling, or driver shortages.
Tools like live GPS view help track on-time performance. By analyzing patterns, departments can adjust routes and revise schedules to minimize delays and improve service reliability.
Maximize Efficiency With Route Optimization
This metric measures how efficiently buses operate. If travel times are too long or fuel consumption is high, it may indicate poor routing or an imbalance in student distribution.
Reviewing historical route data can help identify areas for consolidation, rerouting, or schedule adjustments to ensure efficiency and greater cost savings.
Route optimization tools can streamline the process of collecting and analyzing this data, enabling the department to come up with the most efficient routes.
Analyze Cost-Per-Mile For Improved Budget Management
This metric calculates the total cost incurred per mile driven, including fuel, maintenance, and driver wages. If costs rise, departments should analyze whether factors like excessive idling, inefficient routes, or increased vehicle maintenance are responsible.
Identifying cost drivers enables better budgeting and operational efficiency. To help with this, transportation departments can rely on financial administration tools. This tool increases visibility into your school district’s finances and helps you save costs through accurate budget planning.
Enhance Efficiency Without Sacrificing Accessibility by Evaluating the Number of Stops
The number of bus stops impacts route efficiency and student commute times. Too many stops can lead to longer travel times, while too few may inconvenience students.
Analyzing stop density and student distribution helps optimize stop placement, reducing ride times without compromising accessibility.
Maximize Efficiency By Determining the Right Number of Routes
The number of active routes affects both cost and efficiency. Too many routes may indicate an inefficient use of resources, while too few may lead to overcrowding and longer ride times. Reviewing ridership trends and balancing routes based on demand ensures optimal resource allocation.
Track Driver Attendance to Maintain Service Reliability
Driver attendance is crucial for maintaining reliable service. Frequent absenteeism disrupts schedules and increases reliance on substitute drivers. Tracking attendance trends allows departments to address root causes through incentive programs, improved scheduling, or additional staffing strategies.
Key Takeaways
Interpreting these key metrics allows student transportation departments to make informed, data-driven decisions that enhance efficiency, reduce costs, and ensure safe, reliable transportation. Student transportation can leverage advanced tools for analyzing and acting on trends, departments can proactively address challenges and improve service delivery.
Contact us now to learn more about tools that can be used to track and utilize student transportation metrics!